By Aram, 15
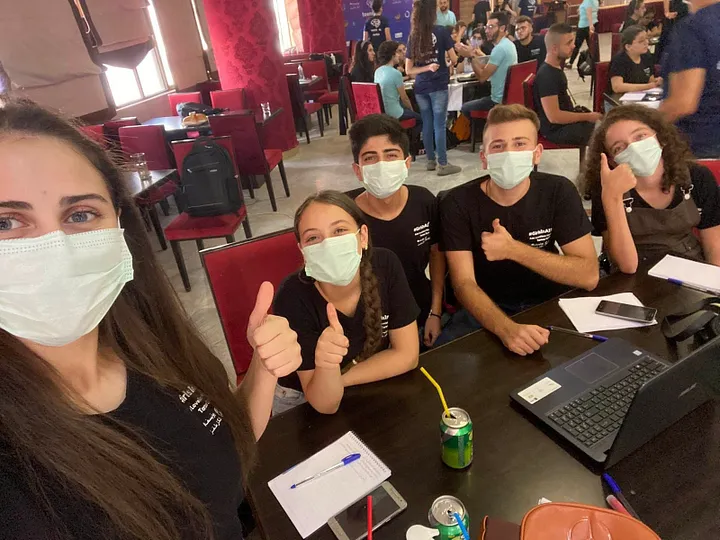
It all started two years ago in a hybrid hackathon hosted in my city. It had a number of coders and non-technical people gather to develop new approaches to solving problems or completing large projects that require collaboration. The participants, mentors and organizers arrived at a hall to start the five-day event. I was a tech and AI mentor for a team of five teenagers. They were building an app that could help link people with mental distress to a therapist using a chatbot (in the pre-gpt era). So basically I helped them build the AI system and the possible technical foundation for the app. Everything was fine until the second day when a BIG problem happend.
All the mentors and the organizers realized that the teams were not making any serious progress and the deadline was just three days away. We were so frustrated and stressed, we could not even figure out what caused this problem even though we were immersed in thinking, but all to no avail and we started to lose hope of solving the problem. I decided to rest for some time to go on a short tour of the contest’s hall. It didn’t take long for me to figure out the cause of the problem. I returned to the organizer’s meeting room and said,
“I think I’ve found the reason. Look at the participants — they are all working by themselves because they do not know each other that well, or maybe they are not comfortable with each other on the same team. Teamwork is almost nonexistent which makes progress and work very slow and inefficient. There are some friends who could make a really good team work if they were put together”
Everyone was given the hope again to start thinking of a solution for the problem. One of the organizers brought up the idea of discussing the relationships between the participants, and that might be helpful in solving the problem. A brilliant idea came up to my mind when he said that.
The idea was to represent the relationships between participants as a Graph and then to use that graph to extract the ideal distribution of teams by applying some algorithms on the graph.
You might be thinking now: What is a graph?
- A graph represents the set of objects, that are related in some sense to each other. The objects can be basically anything, expressed by vertices or nodes, and the relation between the pairs of nodes, is expressed by edges.
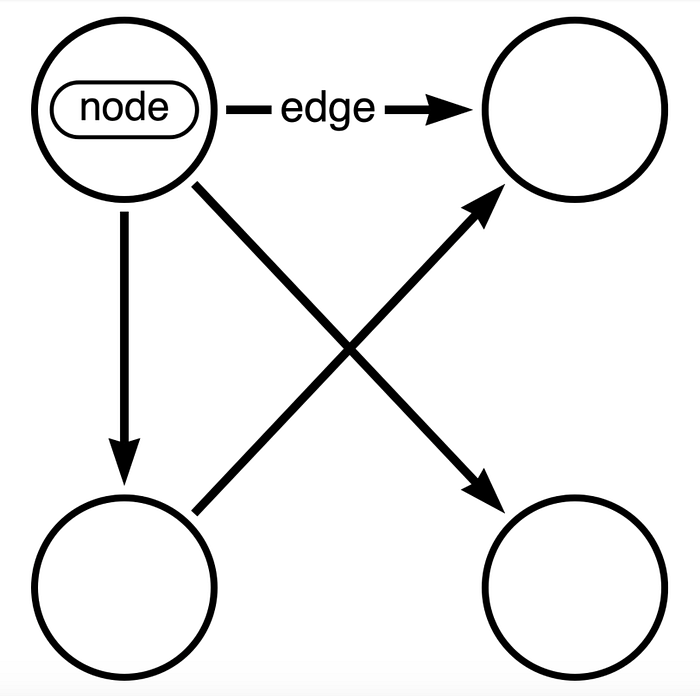
- Edges can be directed, meaning that they connect only one node to the other one, from the start node to the end node of the edge.
- They can also be undirected (that is the type of edges that connects the two nodes to each other in some pair of nodes; it can only go in either direction).
- The edges can also have weights, which could be words, letters, or numbers that express the meaning or value of an edge.
- Components of a graph is a connected subgraph that is not part of any larger connected subgraph. For example, in the image below, there are three components.

Real-life example
The graph below represents a tiny social network: the nodes are the cricles which represent some people and the words ‘classmates’ and ‘siblings’ represent the edges’ weights (which in this case can be denoted as the type of the relation between a pair of nodes)
The core idea
And now that you know what is a graph,a node and an edge…we can start diving deeper into my idea.
I made a graph with the nodes being the participants’ names and the edges having a weight of a number that is not greater than 10 and not smaller than 1 (in my case, the weight of an edge represents the strength of the relation between some pair of nodes, or friends. The higher the number gets, the stronger the teamwork gets between that pair of nodes)
My task is to achieve the most equitable distribution (where even the worst team is working at its finest) of the teams so that teamwork is achieved in the largest possible amount in each of the teams. In simple term, my task is to maximize the performance of the lowest performing team.
The idea, formally
Finally, I wrote down a formal statement of the problem:
Given a graph G with N (2 < N < 1000 and N is divisible by 3) nodes and E (E = n (n-1) /2) undirected edges and the relations where each edge between the pair of nodes {A, B} has a weight (0 < W < 11)
Split the graph into components of threes where:
A team’s ability is the sum of all the weights of the edges that connect between the nodes in that component which represents the team.
Your task is to output the best distribution (the distribution which maximizes the minimum team’s ability between all the teams skills in the graph).
Example
The following was the graph representing the strength of the relationship between the team members.
And then using some special graph algorithms, I managed to solve the problem. The new teams got down to work again on their projects and the hackathon’s productivity rate increased by 70% after restructuring the teams.
In conclusion, I want to extend my sincere appreciation to graph theory for acting as the hero in our story and coming to the rescue not only for me but also for the participants in pitching their completed projects on the final day of the hackathon.
That wraps up this blog, and I want to thank you wholeheartedly for taking the time to read it. I’m eager to hear your thoughts, ideas, or any questions you may have in the comments section below. Your engagement and feedback mean a lot to me. Until next time!